
Imagine launching a digital marketing campaign with high hopes – beautifully designed ads, engaging content, and the perfect targeting strategy. You sit back, waiting for the magic to happen. Weeks pass, and while traffic increases, you are not sure if it is translating into real business results. Sound familiar? If so, you are not alone. Many businesses struggle to measure the effectiveness of their digital marketing efforts.
Success isn’t just about running campaigns – it’s about tracking the right metrics. With endless data available, it’s easy to get lost. Which numbers matter? Which key performance indicators (KPIs) reveal real progress? The key is focusing on actionable insights rather than vanity metrics.
How can you accurately measure the success of your digital marketing efforts? In this guide, we will explore the essential digital marketing metrics, explain how to track them effectively and show you how to use data-driven insights to refine your strategy. Understanding these key performance indicators (KPIs) will help you measure the true impact of your marketing campaigns.
What Are Digital Marketing Metrics?
Digital marketing metrics are measurable data points that help track your marketing performance. These data points help you track performance, spot what is working, and fix what is not. These metrics form the foundation for setting and evaluating your key performance indicators (KPIs).
Now, here is where it gets interesting: metrics and KPIs are not the same. Metrics are the raw numbers you pull from analytics tools, while KPIs are high-level metrics that align with your business goals. Think of it this way; metrics tell you what is happening, but KPIs tell you whether it matters.
Not all metrics are created equal. Different platforms track different data, so you need to focus on the ones that truly impact your business. The more you understand what these numbers mean, the easier it becomes to tweak, optimize, and scale your marketing efforts.
Essential Digital Marketing Metrics to Track
1. Return on Investment (ROI) – Are Your Efforts Paying Off?
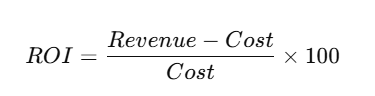
ROI is the ultimate success indicator – it tells you whether your marketing efforts are generating profit or just draining resources. It compares the revenue earned from a campaign against the total cost invested, helping you determine which strategies are worth scaling and which need adjustment. A positive ROI means your campaigns are working; a negative ROI means adjustments are needed.
How to Track It:
- Use Google Analytics to measure revenue generated from campaigns.
- Monitor ad spending through Google Ads and Meta Ads Manager.
- Compare ROI across different campaigns to identify top-performing strategies.
For example, if you spent $5,000 on a campaign and generated $15,000 in revenue, your ROI is 200%. This means your investment tripled in value. To calculate ROI;
2. Conversion Rate – Are Visitors Taking Action?
Visitors are great, but are they converting to sales? Conversion rate is a metric expressed as a percentage of users who have completed a desired action. A high conversion rate indicates that your landing pages, ads, or website effectively persuade users to take action – whether it is making a purchase, signing up for a newsletter, or filling out a contact form.
How to Track It:
- Set up Goals & Events in Google Analytics.
- Use heatmaps (e.g., Hotjar) to analyze user behavior.
- Run A/B tests on landing pages to optimize performance.
For example, if 10,000 visitors land on your page and 500 complete a purchase, your conversion rate is 5%. If it is lower than expected, refining your call-to-action (CTA) or improving page design could help. Calculate your conversion rate by dividing the number of conversions (desired actions) by the total number of visitors or leads, and then multiplying by 100 to express it as a percentage.

3. Click-Through Rate (CTR) – Are People Engaging With Your Content?
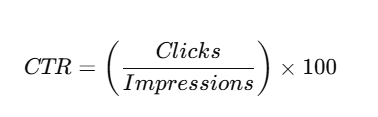
A common KPI is the click-through rate. It applies to any digital campaign that includes a link prompting potential customers to click and visit a landing page. CTR measures how often people click on your ads, emails, or search results compared to how many times they are shown. A low CTR suggests that your messaging may not be resonating with your audience.
How to Track It:
- Check CTR in Google Ads, Facebook Ads Manager, or email marketing platforms.
- Test different ad copies, visuals, and CTA placements.
- Optimize meta titles and descriptions for higher search engine CTR.
For instance, if your ad was displayed 10,000 times and got 300 clicks, your CTR is 3%. If it is below industry benchmarks, consider refining your messaging or visuals. To calculate it, divide the total number of clicks by the total number of impressions, which is another way to describe the number of times people see your ad.
4. Cost Per Lead (CPL) – How Much Are You Paying for Potential Customers?
CPL shows how much you spend to acquire a new lead which tells how profitable your campaigns are. A lower CPL means you are generating leads efficiently, while a high CPL may signal the need for better targeting or a more optimized campaign.
How to Track It:
- Set up conversion tracking in Google Ads and Facebook Ads.
- Measure form completions and sign-ups using CRM tools like HubSpot or Salesforce.
- Compare CPL across different marketing channels to identify the most cost-effective options.
Calculate your CPL by dividing the total marketing spend by the total leads your marketing campaign generated. For example, if you spend $1,000 and acquire 50 leads, your CPL will be $20 per lead. If competitors acquire leads at $10, you may need to adjust your campaign strategy.

5. Cost Per Acquisition (CPA) – The Price of Gaining a Customer
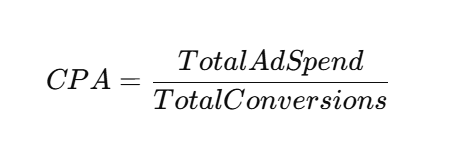
Digital marketing expenses can add up fast, making it essential to monitor your cost-per-acquisition (CPA). CPA tells you how much it costs to convert a lead into a paying customer, allowing you to adjust your strategy if acquisition costs outweigh the revenue generated from those customers. A lower CPA indicates efficient marketing, but this varies based on your industry, product type, and target audience.
How to Track It:
- Use Google Analytics and Facebook Ads Manager to track customer conversions.
- Compare CPA with Customer Lifetime Value (CLV) to ensure long-term profitability.
- Reduce CPA by improving ad targeting, refining content strategy, and optimizing landing pages.
For example, If you spend $5,000 and acquire 100 new customers, your CPA is $50 per customer. If your product sells for $40, you need to optimize your strategy to lower costs. To calculate CPA;
6. Cost Per Click (CPC) & Cost Per Mille (CPM) – Ad Efficiency
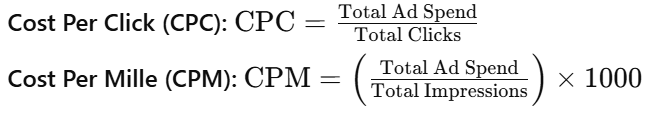
CPC measures how much you pay for each click on your ad, helping assess campaign cost-effectiveness. A high CPC reduces ROI, so the goal is to keep it low while maximizing return on ad spend (ROAS). While CPM tracks how much you spend to reach 1,000 people. Both metrics are critical for managing ad budgets.
How to Track Them:
- Monitor CPC and CPM in Google Ads and Facebook Ads Manager.
- Reduce CPC by refining ad targeting and improving Quality Score.
- Compare CPM across platforms (e.g., Google Display Network vs. social media ads).
To calculate;
7. Customer Lifetime Value (CLV/LTV) – The Long-Term Value of a Customer
Customer Lifetime Value (CLV) measures the total revenue a business can expect from a single customer throughout their relationship with your brand which can be historical, representing the total profit from a customer’s past purchases, or predictive, using past data to estimate future revenue from that customer.
Using customer relationship management (CRM) software, analytics tools, and sales data, you can track CLV. A high CLV indicates strong customer retention, brand loyalty, and marketing effectiveness. The longer they stay, the greater the revenue.
To calculate, multiply the average annual spending per customer by the expected duration of their relationship with your business.

8. Bounce Rate – Measuring Website Retention
Bounce rate represents the percentage of visitors who leave your website after viewing just one page without interacting further. This metric reveals when your website may need improvements. Strong user engagement lowers bounce rates, while a high bounce rate can signal poor user experience, irrelevant content, or slow page speed.
To track bounce rate, use Google Analytics and monitor the percentage of visitors exiting after a single-page session.
9. Engagement Rate – Tracking Audience Interaction
Engagement rate measures how actively users interact with your content across digital platforms. As digital advertisements on social media can be quite pricey, it is imperative to measure your engagement rate. A high engagement rate means your content resonates with your audience, which improves visibility and brand trust. This includes likes, comments, shares, and other interactions. Tracking engagement rates, reach and impressions helps refine social media strategies, ensuring content reaches the right audience at the right time.
To track engagement rates on social media, check insights on platforms like Facebook Insights, Instagram Analytics, and LinkedIn Analytics.
10. Website vs. Channel Traffic – Understanding Traffic Sources
Website Traffic
This metric measures the number of visitors both new and returning over a specific period. It reflects brand awareness, website visibility, and the effectiveness of your digital presence. Ideally, traffic should show steady growth, indicating a successful marketing strategy.
Traffic by Channel
Understanding where your traffic comes from helps refine your marketing efforts. Common channels include:
- Direct Traffic: Users who type your URL directly, are often loyal visitors.
- Organic Traffic: Visitors from unpaid search engine results.
- Referral Traffic: Users coming from external websites linking to yours.
- Email Traffic: Visitors clicking through email campaigns.
- Social Media Traffic: Users arriving via platforms like Facebook or LinkedIn.
- Paid Traffic: Visitors from digital ads, such as PPC or social media ads.
This analysis helps determine which platforms drive the most visitors. By tracking demographics and traffic sources with tools like Google Analytics, businesses can allocate resources effectively to high-performing channels and improve underperforming ones for better ROI.
Tracking these essential digital marketing metrics will give you deeper insights into your campaign performance and help you refine your strategies for maximum impact. By analyzing data consistently, you can make smarter marketing decisions, reduce wasted ad spend, and improve your return on investment.
Want expert help to optimize your digital campaigns? Contact MainPromo for a personalized strategy session.


Lydia681
Very good